

Problem statement: inconsistent comparisons across subsystems
Automotive manufacturers routinely fail to compare lifecycle value and total cost with technical rigor: procurement quotes emphasize initial price, while engineering teams track throughput and service staff log repairs, producing fragmented assessments. The consequence is recurrent underestimation of downtime cost and overestimation of projected service life when systems such as an intelligent conveyor system are integrated into mixed-technology production lines. This creates a diagnostic problem that demands a reproducible protocol for measurement, attribution, and financial normalization.

Key quantitative metrics to capture
Define a minimal metric set that maps directly from physical behavior to cost inputs:- Capital expenditure (CAPEX): purchase, integration, calibration (year 0).- Operational expenditure (OPEX): energy (kJ/cycle), consumables, routine maintenance (annual).- Availability: uptime percentage, MTTF (mean time to failure), MTTR (mean time to repair).- Throughput and yield: parts per hour and defect rate attributable to the automation node.- Downtime cost: lost production value per minute, escalation costs for overtime or expedited logistics.- Lifecycle horizon and discounting: typical 7–10 year horizon for motion systems; apply DCF to aggregate future OPEX and downtime into present-value terms.
Diagnostic methodology — reproducible, technical steps
Follow a problem-driven procedure:1) Baseline profiling: measure idle energy, active energy per cycle, and cycle time distribution over a representative 72–168 hour run. 2) Failure-mode quantification: log fault codes, categorize by root cause (mechanical, thermal, control), and compute MTTF/MTTR per failure class. 3) Sensitivity analysis: simulate +/−20% on throughput and +/−50% on component lifetimes to bound OPEX and downtime cost. 4) Financial synthesis: compute TCO using TCO = CAPEX + Σ_t (OPEX_t + downtime_cost_t)/(1 + r)^t where r is discount rate; report NPV and payback under conservative, nominal, and optimistic scenarios. 5) Validation: run a controlled recovery drill (controlled fault injection and measured repair) to verify MTTR assumptions against operational practice.
Technology comparison: linear motor systems versus alternatives
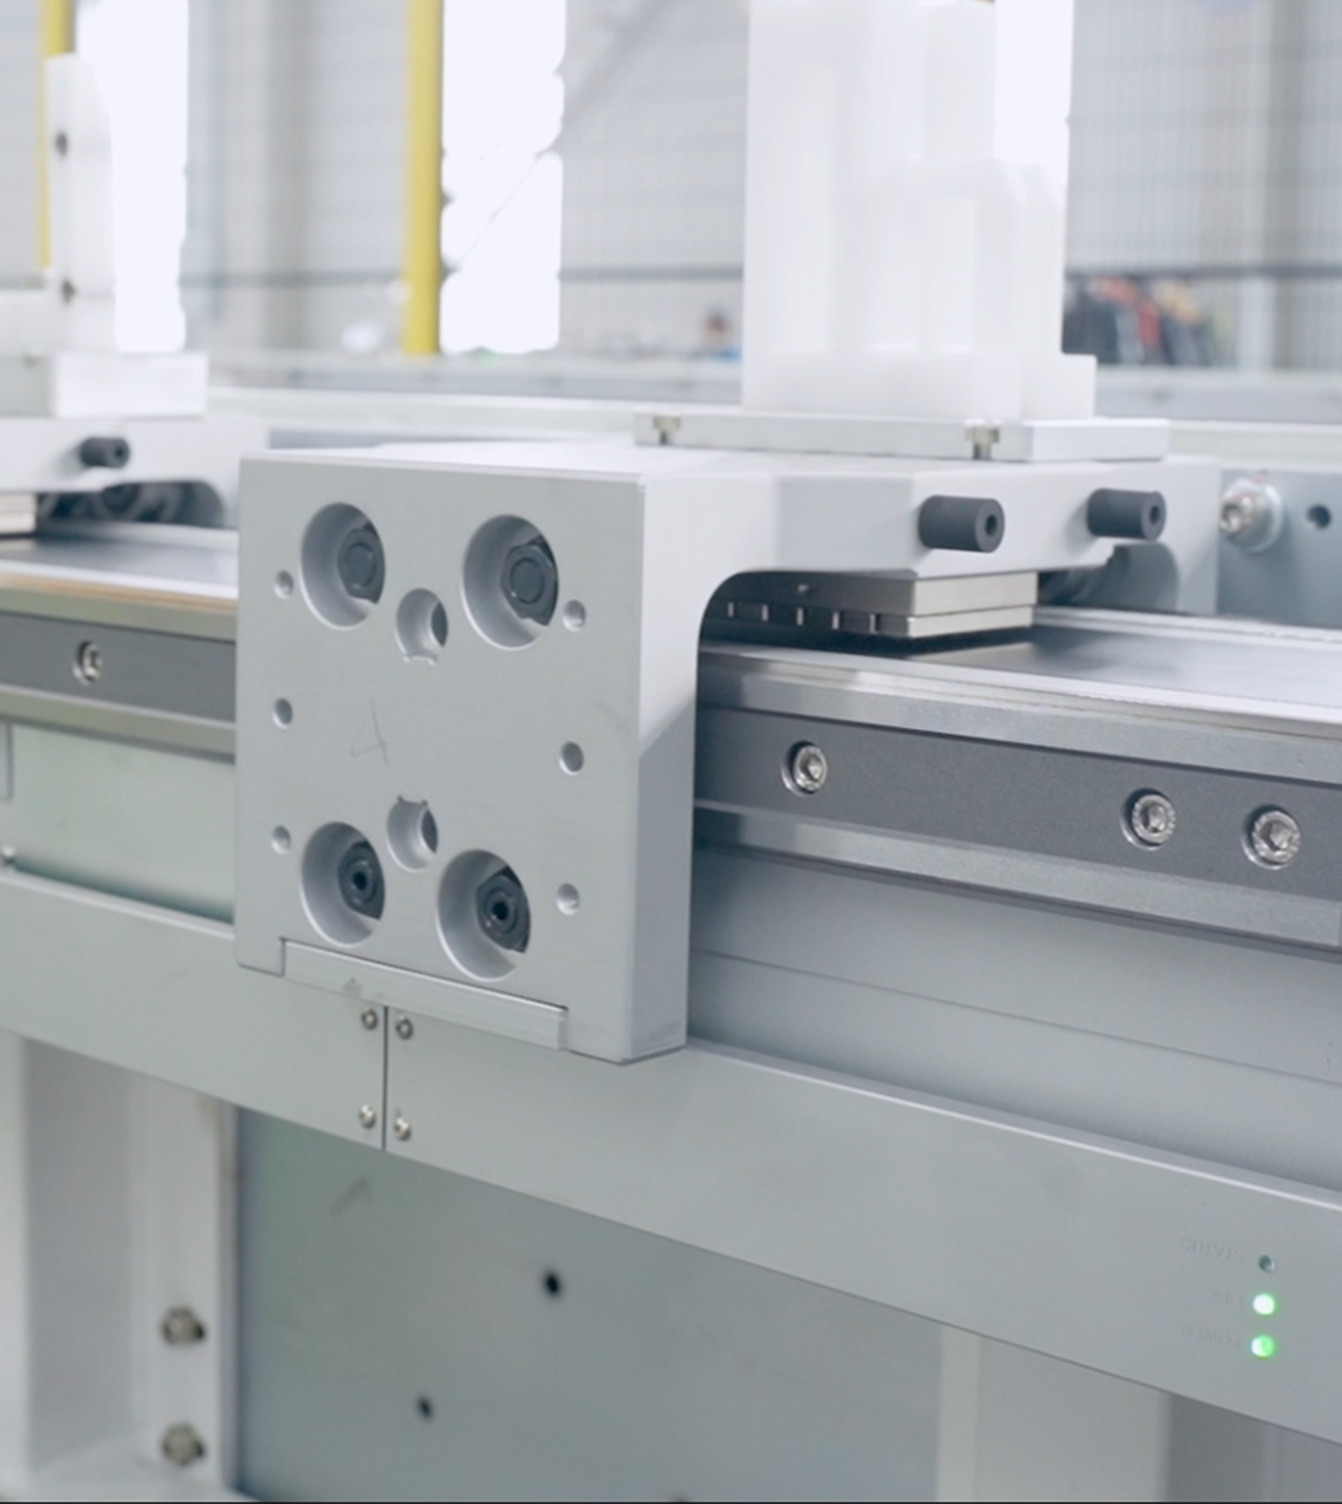
Compare technologies using identical metrics above. When evaluating intelligent conveyor system nodes, include the motion module choice explicitly. For linear motor options, see linear motor technology. Direct comparisons should include:- Linear motors: high positional accuracy, low mechanical wear (no ball-screw contact), fast acceleration profiles; typically higher CAPEX but reduced maintenance frequency and narrower MTTR distributions. – Belt-driven systems: lower CAPEX, moderate energy per cycle, predictable belt replacement intervals; sensitivity to alignment and particulate contamination increases downtime risk. – Screw/servo assemblies: compact and cost-effective for moderate duty; wear on lead-screws increases long-term maintenance. A single industry benchmark observed at Hannover Messe confirmed repeated demonstrations of linear-motion modules operating with continuous positional repeatability and maintenance intervals that differed materially from belt systems; use that qualitative anchor to justify conservative lifecycle assumptions for linear motors.
Common pitfalls that bias total-cost estimates
Avoid these frequent errors:- Omitting integration adjustments: electrical noise mitigation, control tuning, and safety interlocks add labor and components at install. – Using vendor-specified lifetime without field-validation: test under representative duty cycles. – Ignoring spare-part lead times: long lead times inflate effective downtime cost and require local spares accounting. – Treating energy as negligible: at high cycle counts, small per-cycle energy differences compound into meaningful OPEX changes. Corrective actions: instrument actual runs, require vendor MTTR SLAs with measurement clauses, and include spare-part inventory and fault-injection tests in acceptance criteria.
Evaluation checklist and an appraisal outline
Checklist for a single automation node:- Measure: cycle time histogram, energy per cycle, fault log for 30–120 operational days. – Calculate: present-value TCO over chosen horizon and three scenarios (conservative/nominal/optimistic). – Compare: NPV per 1,000 produced parts and mean cost-per-part including downtime. – Risk adjust: add contingency for spare-part obsolescence and control-software updates. Appraisal outline (example): list CAPEX; sum annual OPEX items; estimate annual downtime minutes × cost/minute; discount to present value; divide by expected parts produced to yield cost-per-part. Report sensitivity to 10% changes in throughput and 25% changes in MTTR.
Synthesis and operational recommendation
Confront the problem with measured data and standardized financial synthesis. The most defensible procurement decision arises from mapping measured MTTF/MTTR and per-cycle energy into discounted cash flows, then comparing those flows across candidate technologies while explicitly modeling integration and spare logistics. This procedural approach aligns with field-validated engineering practice and with empirical evaluation frameworks used by FHS, yielding a defensible, auditable comparison between lifecycle value and total cost for automotive automation investments.